Water Quality
Water quality refers to the physical, chemical and biological attributes of water that determine its suitability to support aquatic life and safety for human enjoyment. VCU faculty associated with the Rice Rivers Center and the Center of Environmental Studies carry out research investigating a range of water quality issues, and are committed to providing data that can be used by policy makers to make informed decisions to improve water quality.
The Rice Rivers Center conducts water quality monitoring in the tidal freshwater segment of the James River Estuary. This portion of the estuary is influenced by tidal forces from the ocean, but is freshwater due to inputs from the James River. The tidal fresh segment of the James is highly productive supporting large numbers of gizzard shad, threadfin shad and catfish, as well as their predators, including bald eagles and osprey.
Water quality monitoring activities include weekly cruises along the estuary from Richmond to the confluence with the Chickahominy. We sample at 10 stations along this 50-mile stretch to assess water quality conditions. In addition, we have an array of sensors installed on the Rice Rivers Center Pier, which monitor water quality conditions at 15 minute intervals.
Monitoring parameters include:
- Water temperature
- Dissolved oxygen
- pH
- Water level
- Turbidity (a measure of suspended particulate matter)
- Chlorophyll (an indicator of algal abundance)
- Nutrients (nitrogen, phosphorus and silica)
- Suspended sediments
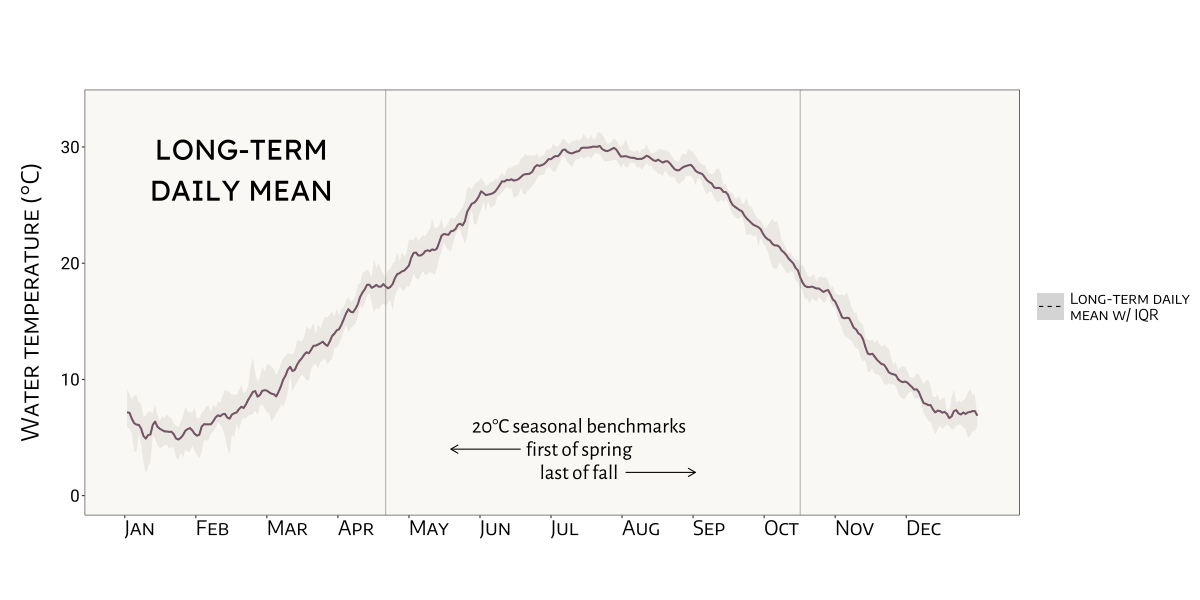
The animation below depicts seasonal patterns and inter-annual variation in water temperature at the Rice Pier. The timing of the Spring warm-up (indicated by water T reaching 20 C) is typically around April 23rd, but in some years occurs as early as March 23rd or as late as May 16th. By contrast, the timing of the Fall cool-down is typically around October 9th, and only varies by a few days across years. The year-to-year variation in the timing and duration of the warm water period affects a variety of ecological processes including aquatic insect emergence (mayflies, caddisflies, etc.), fish migration and spawning and the occurrence and intensity of algal blooms. Animation by Andrew Cameron (Center for Environmental Studies). For questions about the data, please contact Dr. Paul Bukaveckas.
Water quality in the James River estuary
Learn more about the water quality in this tidal section of the James River.
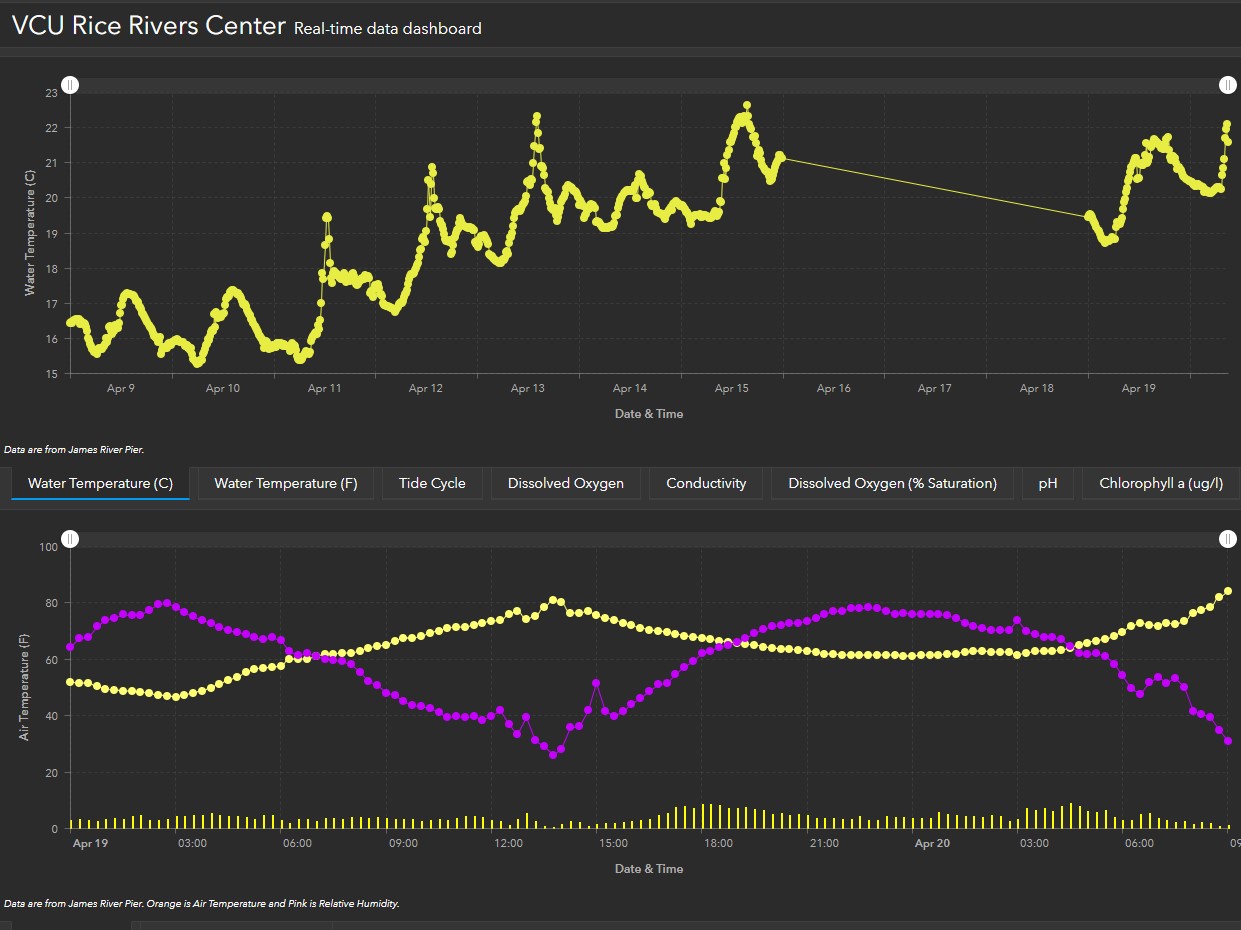
Rice Rivers Center real-time data dashboard
Water quality, air temperature, weather and other environmental data points collected at our James River pier at Rice Rivers Center can be viewed at our up-to-the-minute dashboard.